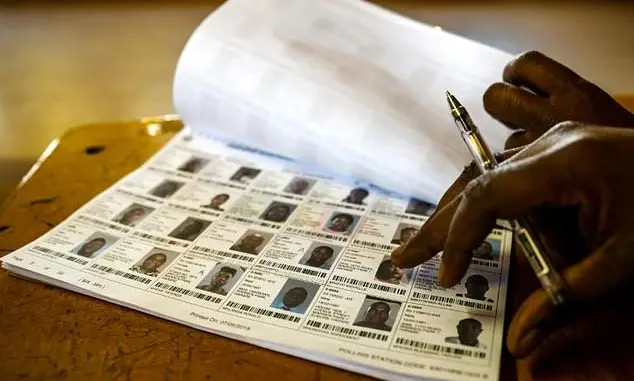
According to the 2023 voters roll statistics, there are 6,619,691 registered voters in Zimbabwe.
Women make up the majority of the voters. There are 3,551,997 female voters which is 53.7 percent of the total number of registered voters. Men are 3,067,694 which translates to 46.3 percent of the voting population.
The highest number of voters are in Harare province with 907,752 excluding those in Chitungwiza.
Bulawayo province has the least number of registered voters, 287,220.
| Province | Male | % Male | Female | %Female | Total |
| Bulawayo | 134,443 | 46.8 | 152,777 | 53.2 | 287,220 |
| Chitungwiza | 82,957 | 47.1 | 93,103 | 52.9 | 176,060 |
| Harare | 453,288 | 49.9 | 454,464 | 50.1 | 907,752 |
| Manicaland | 362,408 | 43.7 | 466,898 | 56.3 | 829,306 |
| Mashonaland Central | 297,795 | 47.6 | 328,182 | 52.4 | 625,977 |
| Mashonaland East | 355,706 | 46.0 | 416,889 | 54.0 | 772,595 |
| Mashonaland West | 386,267 | 49.3 | 397,963 | 50.7 | 784,230 |
| Masvingo | 309,627 | 42.8 | 413,601 | 57.2 | 723,228 |
| Matabeleland North | 164,150 | 44.2 | 207,447 | 55.8 | 371,597 |
| Matabeleland South | 131,148 | 43.6 | 169,617 | 56.4 | 300,765 |
| Midlands | 389,905 | 46.4 | 451,056 | 53.6 | 840,961 |
| Total | 3,067,694 | 46.3 | 3,551,997 | 53.7 | 6,619,691 |
